
architecture
The map is not a picture. It's a database: the BIM lesson geospatial must borrow before AI gives up on maps
Construction and cartography independently invented the same idea: a model as a database of objects with properties, relationships, and measurements, where geometry is one view, not the definition. Biology has a name for that pattern — convergent evolution. This article traces the two lineages, verifies the convergence in the standards themselves, and shows why AI is the selection pressure that makes the commitment urgent.
AI-generated draft · reviewed and editedThis text was generated with AI as a first draft, then reviewed and edited by the author, who holds editorial responsibility for it.

The map is not a picture. It's a database: the BIM lesson geospatial must borrow before AI gives up on maps
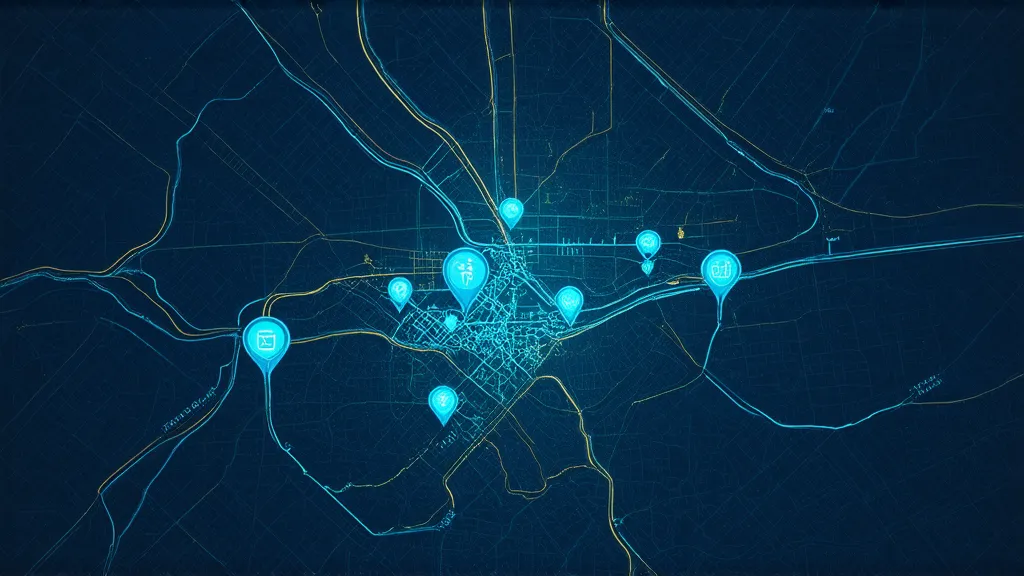
Ask a rendered map the question that decides real projects — which fuel stations inside this flood plain can a fire truck reach without crossing a rail line? — and it says nothing. A picture has pixels, and pixels have no commitments: no height on the building, no access relation on the road, no membership in the flood zone. Ask a database of objects — buildings with attributes, roads with connectivity, parcels with containment — and the answer falls out of the data. Here is the striking part, and the thesis of this article: construction and cartography independently built that database-shaped answer, half a century apart and in complete ignorance of each other. Biology has a name for independent inventions of the same structure, and the name explains why geospatial should borrow BIM’s paradigm — and why it must not borrow BIM’s tools.
Two fields, one invention: convergent evolution of an idea
Biology has a precise term for the octopus and the human both arriving at the camera eye: convergent evolution — "organisms that aren’t closely related evolve similar features or behaviours, often as solutions to the same problems" (Natural History Museum, London). The cephalopod and vertebrate visual systems are "a textbook example of convergent evolution" (Gavriouchkina et al., Nature Ecology & Evolution, 2025). The crucial distinction is between analogy and homology: analogous structures have "separate evolutionary origins, but are superficially similar because they have both experienced natural selection that shaped them to play a key role in flight," as UC Berkeley’s Evolution 101 puts it for bird and bat wings. Same function, independent origin. What cognitive science adds is when such a borrowed idea is legitimate: Gentner’s structure-mapping theory is unequivocal that analogy maps relations between objects, rather than attributes of objects (Gentner 1983). An analogy is strong exactly when the relational skeleton transfers — and weak when only the surface resemblance does.
That is the scientific frame for this article’s claim. BIM and geospatial are unrelated lineages — one descended from construction documentation, the other from military and civilian cartography — and they independently arrived at the same structure: the model as a database of typed objects with properties, relationships, and measurements, where geometry is one view, not the definition. When two fields facing the same problem — complex, changing, multi-viewed worlds that must be queried, not just rendered — independently evolve the same solution, that is evidence the solution is fit for purpose. The analogy is a wing, not a decoration.

What the analogy is — and is not
The mapping is relational. Gentner’s constraint: borrow the relations, not the surface. Building ↔ city (both are worlds of typed entities); wall ↔ building-footprint (objects with identity and properties); a wall belongs to a storey ↔ a building belongs to a parcel (containment); LOD levels ↔ levels of detail; quantities that must be queryable without re-measuring geometry. Surface terms differ — storey, parcel, wall, polygon — the structure is identical.
The mapping is not an injunction to adopt BIM tooling. The distinction between a paradigm and a tool is the whole point. A paradigm is a way of seeing; a tool is a way of doing. Construction’s specific machinery — IFC schemas, ifcOWL, buildingSMART tooling — is an implementation of the paradigm in a specific domain, and it does not transfer. Cornuéjols, Tiberghien and Collet call this transfer between conceptual domains: carrying the organising idea across a domain boundary "while leaving the domain-specific machinery behind."
Lineage one: BIM is a paradigm, not a product
The construction industry’s object model has a traceable history, and it starts earlier than most people think. In 1975, Charles M. Eastman published "The Use of Computers Instead of Drawings in Building Design" in the AIA Journal, describing his Building Description System (BDS) — and in 1976 he gave the idea its scholarly form in Computer-Aided Design: "A building description system is a database capable of describing buildings at a detail allowing design and construction." A database. Not a drawing. That sentence is the birth certificate of BIM, and it states the paradigm exactly: the model is a data structure from which drawings are one output among many.
The term took two more decades to stabilize — Jerry Laiserin’s LaiserinLetter campaigned for "Building Information Modeling" as the single term to replace CAD until Autodesk and Bentley "hum[med] the BIM tune" (his phrase) — but the paradigm was already fixed by Eastman’s founding claim. The open standard that encodes it, IFC (Industry Foundation Classes), is governed by buildingSMART and published by ISO as ISO 16739 (now ISO 16739-1:2024), and buildingSMART’s own framing is unambiguous: "the IFC standard is much more than just a file format. It is primarily a data schema explaining how to organise objects, their properties, relations and more." IFC is one expression of the paradigm — a deliberately construction-specific one — not the paradigm itself.
And the scholarly consensus holds that the paradigm precedes any product. The BIM Handbook — now in its 4th edition (Sacks, Lee, Burdi & Bolpagni, Wiley, 2025) — builds everything on object-based parametric modeling: objects that "consist of geometric definitions and associated data and rules," where parametric rules "automatically modify associated geometries." Peer-reviewed literature says it outright: "Currently, we are witnessing a second paradigm shift and its name is BIM" (Russell & Elger, eCAADe 2008) — a semantic layer added to geometry, a single building data model used collectively. Khosrowshahi’s 2017 Springer chapter anchors the same claim in the UK’s 2016 BIM mandate. BIM was never software. It was the decision that a building is a database.
The five commitments (what the paradigm actually is)
Strip BIM to its conceptual core and you get a small set of domain-neutral commitments — the invariant structure that both lineages independently discovered:
- Objects, not drawings. A model is a collection of typed objects with identity — a wall, a storey, a grid; a building, a road, a parcel, a hydrant — not a set of lines or pixels.
- Properties, not symbology. Each object carries attributes — height, material, function, owner, status. Cartography’s symbology becomes a rendering choice, not the data.
- Relationships, not just adjacency. Objects are connected by explicit relations — a wall connects to a slab; a building belongs to a parcel. Topology is the start; semantics is the destination.
- Quantities, not just geometry. Derived measures — area, length, volume, count — are first-class, queryable data, not something a human re-measures off a picture.
- Levels of development, not a single resolution. The same object exists at multiple fidelities — footprint to detailed solid — with the relations between levels explicit. BIM calls it LOD; CityGML calls it LOD0–LOD3. The convergence even extends to the vocabulary.
None of these commitments requires IFC, BIM software, or buildingSMART. They are a way of thinking about a model. Geospatial has independently built most of the machinery to express every one of them — what it has lacked is the deliberate, industry-wide conceptual commitment.
Lineage two: geospatial invented it too
It is a cliché that cartography is about pictures, and the field’s own critical theory refutes it. J.B. Harley’s "Deconstructing the Map" (Cartographica, 1989) dismantled the claim that a map is a neutral mirror of reality: "the map is never neutral. Where it seems to be neutral it is the sly ‘rhetoric of neutrality’ that is trying to persuade us." Denis Wood’s The Power of Maps (1992) drives it home: maps are "instruments of communication, persuasion, and power... they express a point of view." A map, the cartographers concluded decades ago, is a model — a set of claims about the world — not a picture of it. The philosophy of the field was object-based before its data standards were.
The standards then caught up. The OGC’s own definitions draw the line between picture and object: WMS "provides a simple HTTP interface for requesting geo-registered map images" — it returns pictures — while WFS "defines direct fine-grained access to geographic information at the feature and feature property level" — it returns objects with attributes. GeoJSON made the object the unit of the web map: "A Feature object represents a spatially bounded thing" (RFC 7946, §3.2), a Geometry plus properties. And OGC GeoSPARQL 1.1 made features first-class citizens of a queryable graph — features that sit "in SPARQL graph patterns," associated with geometries and with each other through spatial relations.
CityGML. The OGC’s semantic 3D city model is the geospatial field’s own object paradigm, developed without reference to construction’s IFC — and its motivation section describes, with academic restraint, the exact failure mode this article is about:
"In recent years, most virtual 3D city models were defined as purely graphical or geometrical models, neglecting the semantic and topological aspects. Thus, these models could almost only be used for visualization purposes but not for thematic queries, analysis tasks, or spatial data mining." — CityGML 3.0 Conceptual Model (OGC 20-010)
CityGML decomposes a building into semantic surfaces, carries attributes, supports topology, and defines levels of detail (LOD0–LOD3) — the same move BIM made, invented independently. And Overture Maps Foundation — the Linux Foundation project started by Amazon, Meta, Microsoft, and TomTom — has quietly completed the object turn at planetary scale: a typed-feature database whose Global Entity Reference System assigns stable IDs to real-world entities ("GERS gives every feature a unique, stable identifier. Think of it as a universal address system for geographic entities" — executive director Will Mortenson, 2026). The picture and the data are now two different products — and the data side is winning.
The map as a graph: the paradigm made concrete
Commit to the object paradigm and a powerful consequence follows: the map becomes a graph. Objects are nodes; relationships are edges. A building contains a place; a place has an address; a road connects two intersections; a parcel is within a district. This is not a metaphor — it is now a working prototype, and its key sentence is the best line in this whole debate:
"Geometry is the foreign key. If a place sits inside a building, the data already knows they are related. Nobody had to write that link by hand." — Overture Maps Foundation, 2026
Overture’s prototype ORATOR "runs on pure spatial derivation": when a place point falls inside a building polygon, a spatial predicate turns the physical fact into a graph edge automatically. It names the cost of the alternative the "conflation tax": "a recurring cost the whole downstream ecosystem pays to rebuild relationships that the geometry already implies." The proof-of-concept numbers:
- San Francisco Bay Area: 700,000+ nodes, 1.2M+ edges, ~8 min build time.
- Manhattan: ~400k nodes, 3.5M edges, ~10 min build time.
- 8 semantic edge types —
located_in,has_address,access— derived from geometry, not hand-written. - Access-edge inheritance collapses ~610,000 naive edges into ~172,000 semantically correct ones.
The knowledge-graph literature says the same thing from the research side. The geospatial knowledge graph survey (Zhu 2024, Wiley International Encyclopedia of Geography / arXiv:2405.07664) defines GeoKGs as graphs where "entities such as places, people, events, and observations are depicted as nodes, while their relationships are represented as edges." The KnowWhereGraph — one of the largest public GeoKGs — "leverages space and time as first-class citizens, i.e., as the nexuses to interlink knowledge from different disciplines" (arXiv:2502.13874). Wherobots’ "Spatial Graph RAG" put the industry case in one line: "the most consequential relationships in the physical world aren’t always written down. They’re spatial."
Why AI makes the paradigm urgent
The reason this matters now is that AI is the first major consumer of maps that cannot work with a picture. Three forces converge:
1. Pixels encode appearance and discard structure. Geospatial foundation models like NASA–IBM’s Prithvi-EO-2.0 (arXiv:2412.02732) are trained on 4.2 million satellite time-series samples at 30-m resolution — and imagery is still only one layer of the map. The moment you ask "which buildings in this district exceed 40 metres and lie within 200 metres of a flood zone," a pixel model is silent. That question needs objects with height, location, and relationships.
2. LLMs hallucinate without queryable objects. GeoLLM (ICLR 2024) demonstrated "that LLMs embed remarkable spatial information about locations, but naively querying LLMs using geographic coordinates alone is ineffective." A 2025 benchmark on geospatial hallucination (arXiv:2507.19586) found LLMs "often generate inaccurate geospatial knowledge, leading to geospatial hallucinations... that compromise their reliability." The counter-evidence is just as clear: knowledge-graph grounding measurably reduces hallucination (Agrawal et al., NAACL 2024), and Microsoft’s GraphRAG shows graph-structured retrieval beating flat retrieval on relationship-heavy questions (arXiv:2404.16130).
3. The map must answer, not just render. This is the CityGML motivation restated for the AI era. A map that only renders is a dead end for AI. A map that answers "what is here, how tall, what is it connected to, what can reach it" is a reasoning substrate.
The readers are graph-native: GNNs
There is a second, deeper reason the graph framing matters: the AI architectures built to reason over connected objects are graph neural networks, and they are already reading maps. DeepMind’s position paper on graph networks argues that "combinatorial generalization must be a top priority for AI" and that structured, relational representations are how it will be achieved (Battaglia et al., arXiv:1806.01261). A GNN learns by message passing — its receptive field is defined by connectivity, not by a pixel grid. The canonical GCN paper (Kipf & Welling, ICLR 2017) presented "a scalable approach for semi-supervised learning on graph-structured data," and the map-as-graph is exactly that data shape: roads as edges, intersections and buildings as nodes.
The applications are production-grade: STGCN models road networks as graphs for traffic forecasting, "modeling multi-scale traffic networks" with convolutional structures (IJCAI 2018); graph representation learning classifies road types across 17 OpenStreetMap cities (Pattern Recognition, 2022); and OSM has been transformed into a planet-scale spatial-temporal knowledge graph on an H3 grid — because, as that paper puts it, "a graph based representation provides the possibility to interconnect entities which would have been separated in a tabular representation" (arXiv:2405.15375). The technical argument is clean: pixels encode appearance but discard topology; flat tables encode attributes but discard connectivity. A graph encodes both.
Convergence is not a forecast — it is funded and running
The two fields are actively converging, and the peer-reviewed literature frames the blocker as semantics, not software: "Most problems regarding BIM-to-GIS data conversion have been solved... while those unsolved problems are mainly related to representation transformation and semantics mapping" (Zhu & Wu, Automation in Construction, 2022).ISPRS work now treats IFC–CityGML correlation as a declarative schema-mapping problem (Tauscher, 2020), and an ITcon critical review concludes "the data interoperability problem in this field still needs to be addressed" (Demir Altıntaş & İlal, ITcon 2022). At national scale, the convergence is already funded:
- Virtual Singapore — the world’s first digital twin of a country, fusing LiDAR survey data with asset-level building data on one common 3D city model for every public agency (SLA/Smart Nation).
- Destination Earth (DestinE) — the EU’s digital twin of the Earth system, targeting a full replica by 2030, with first twins on climate adaptation and weather extremes.
- The UK National Digital Twin — "federations of digital twins joined together via securely shared data," governed by the Gemini Principles, whose information value chain names GIS and BIM as feeds of the same system.
Every one of these is a map-as-database. None of them is a picture.
What geospatial should actually borrow — a checklist
- Commit formally to the five commitments — objects, properties, relationships, quantities, levels of development — as policy, not accident. The machinery already exists; the missing piece is the deliberate conceptual commitment.
- Adopt stable entity identity. Overture’s GERS shows the pattern: IDs that survive data releases are what let objects be referenced, reasoned over, and linked across datasets.
- Treat derived relations as first-class data. ORATOR’s lesson — stop paying the conflation tax; let spatial predicates materialize graph edges once, then query them forever.
- Do not import IFC or BIM tooling. IFC’s walls and doors are construction-specific. Borrow the paradigm; leave the machinery across the domain boundary — that is what makes the transfer analogical and sound.
- The acceptance test: can an AI agent answer questions about your map — containment, access, adjacency, quantity — without ever seeing it rendered? If not, you have published a picture.
The bottom line
Two fields, one invention. Construction spent four decades turning drawings into databases, and cartography independently built the same object model into its own standards — convergent evolution, which is what happens when the same problem has the same solution. The BIM lesson is not a product to buy; it is the decision to treat the world as objects with properties, relationships, quantities, and levels of development — rendered as one view among many, and interconnected as a graph. AI is the selection pressure that makes the commitment non-optional: the first consumer that cannot look at a picture. Borrow the paradigm, not the tool. The map is not a picture. It never really was. It is a database — and a graph — and the fields that commit to that idea first are the ones that AI will actually be able to read.
Sources
- Convergent evolution — Natural History Museum London, "Convergent evolution explained" (nhm.ac.uk/discover/convergent-evolution.html); Ogura, Ikeo & Gojobori, Genome Research 14(8), 2004 (DOI 10.1101/gr.2325604); Yoshida et al., Integrative and Comparative Biology 55(6), 2015 (PMCID PMC4652037); Gavriouchkina et al., Nature Ecology & Evolution 9, 2025 (DOI 10.1038/s41559-025-02720-9); UC Berkeley Understanding Evolution, "Homologies and analogies" (evolution.berkeley.edu)
- Analogy / transfer theory — Gentner, Cognitive Science 7(2), 1983 (DOI 10.1207/s15516709cog0702_3); Gentner & Markman, American Psychologist 52(1), 1997; Cornuéjols, Tiberghien & Collet, Foundations of Science 5(2), 2000 (DOI 10.1023/A:1011398802965)
- Cartographic theory — Harley, "Deconstructing the Map," Cartographica 26(2), 1989 (DOI 10.3138/E635-7827-1757-9T53); Wood, The Power of Maps, Guilford Press, 1992; Monmonier, How to Lie with Maps, University of Chicago Press (3rd ed. 2018)
- BIM origins & paradigm — Eastman, "The Use of Computers Instead of Drawings in Building Design," AIA Journal 63(3), 1975; Eastman, "General purpose building description systems," Computer-Aided Design 8(1), 1976 (DOI 10.1016/0010-4485(76)90005-1); LaiserinLetter Issue 15 (2002, laiserin.com); Sacks, Lee, Burdi & Bolpagni, BIM Handbook, 4th ed., Wiley, 2025 (DOI 10.1002/9781394222254); Russell & Elger, "The Meaning of BIM," eCAADe 26, 2008; Khosrowshahi, "BIM a Paradigm Shift in Construction," Springer, 2017 (DOI 10.1007/978-3-319-50346-2_4)
- IFC / buildingSMART — buildingSMART, "Industry Foundation Classes (IFC)" (buildingsmart.org); ISO 16739-1:2024 (iso.org)
- OGC standards — WMS (OGC 06-042); WFS (OGC 09-025r1); GeoJSON RFC 7946 (rfc-editor.org); CityGML 3.0 Conceptual Model, OGC 20-010 (docs.ogc.org); GeoSPARQL 1.1, OGC 22-047r1 (docs.ogc.org)
- Overture Maps — GERS documentation (docs.overturemaps.org/gers); "Three Years In" (overturemaps.org, 2026); Wiedersberg, "From Concept to Prototype: Grounding AI & LLMs with Overture’s Cross-Theme Knowledge Graph" (overturemaps.org/blog/2026, 2026)
- Spatial Graph RAG — Wherobots, "Spatial Graph RAG: Building Knowledge Graphs From the Physical World" (wherobots.com/blog/spatial-graph-rag, 2026)
- Geospatial knowledge graphs — Zhu, "Geospatial Knowledge Graphs," Wiley Int. Encyclopedia of Geography, 2024 (arXiv:2405.07664); Janowicz et al. / Zhu et al., The KnowWhereGraph (arXiv:2502.13874); GeoLLM, ICLR 2024 (arXiv:2310.06213); geospatial hallucination (arXiv:2507.19586); Agrawal et al., "Can Knowledge Graphs Reduce Hallucinations in LLMs?", NAACL 2024 (arXiv:2311.07914)
- GNNs — Battaglia et al., "Relational inductive biases, deep learning, and graph networks," 2018 (arXiv:1806.01261); Kipf & Welling, GCN, ICLR 2017 (arXiv:1609.02907); Yu, Yin & Zhu, STGCN, IJCAI 2018 (arXiv:1709.04875); Gharaee et al., Pattern Recognition 131, 2022 (arXiv:2107.07791); Böckling et al., OSM+H3 planetary KG, GeoLD @ ESWC 2024 (arXiv:2405.15375)
- GeoAI — Prithvi-EO-2.0, NASA & IBM (arXiv:2412.02732)
- BIM–GIS convergence — Zhu & Wu, Automation in Construction 136, 2022 (DOI 10.1016/j.autcon.2022.104133); Tauscher, ISPRS Archives XLIV-4/W1-2020 (DOI 10.5194/isprs-archives-XLIV-4-W1-2020-151-2020); Demir Altıntaş & İlal, ITcon 27, 2022 (DOI 10.36680/j.itcon.2022.027)
- Digital twins — Virtual Singapore (SLA / Smart Nation; oecd-opsi.org/innovations/virtual-twin-singapore); Destination Earth (destination-earth.eu); Bolton et al., The Gemini Principles, CDBB, 2018 (DOI 10.17863/CAM.32260)
keep reading

The Architect's New Instrument: How AI Agents Are Rewiring the Entire Design-to-Operations Workflow
AI agents are not a faster pencil — they are a new agent of production. From site analysis and generative ideation to drafting, fully functional BIM, and facility management, this is how the data generated at every stage compounds into value, and why the architect who does not integrate AI is forfeiting the data dividend.
architecture · 45 min · 2026-08-31

The Model That Would Not Speak: System One AI on Your Own Machine
One support ticket, three decision models, no graphics card: I ran 144M, 421M and 4.2B System One models on my own CPU and wrote down what each one said. The 144M model missed "I am cancelling on Friday"; the vague ticket produced three different answers. What a decision model is, how to run one with llama.cpp or Ollama, and how Kev, Nimble, Laya and Jev compare.
ai · 19 min · 2026-10-14
Mistral Large 4: The Cybersecurity Model That Refuses to Refuse
Six frontier models refuse ≥98% of real CVE reproduce-and-patch tasks. Mistral Large 4 completes them — and gets 82% right, the highest score ever measured. Charts, independent failure data, and the honest anatomy of what a defender’s model can and cannot do.
ai · 18 min · 2026-10-07